
Statistics deals with methods for collecting, summarizing, analyzing, interpreting and presenting data. Statistics is a highly interdisciplinary field, since it can be applied virtually everywhere. Everywhere you have data. The theory underlying statistical methods deeply rely on mathematical and computational tools, though the majority of users are not really aware of this.
Data means a lot of information. A lot of information would bring important, relevant, and decisive insights if deduced (inferred) in the right way. Sometimes results are great and valuable, but wrong. These are some of the typical mistakes in the analysis of data. The list would be much longer, since theoretical background, programming skills, and practical experience all contribute to producing meaningful results. In the following we highlight a few pitfalls to avoid while looking for answers from data.
The plural of anecdote is not data
What do we mean with “anecdote”? A typical example comes from medicine, where for completely valid scientific reasons single-case or few-cases studies are described in full details and published. See for example Oxford Medical Case Reports, publishing insightful cases across all medical specialties.
However, none of these reasons can have statistical significance. Statistical inference is the process of deducing properties of an underlying distribution by analysis of data. Inferential statistical analysis infers properties about a population: this includes testing hypotheses and deriving estimates. The observed data is assumed to be sampled from a larger population, otherwise there’s no point in analyzing data. By means of data from a sample, you look for information on the whole population. Any data face the problem (a huge problem) of how representative it is of such a population. Very often users, clients, or even researchers, are impressed by techniques working on a case study. It doesn’t mean they work. That’s why statistics is necessary, and not an option.
Small samples don’t give you so much information
Is that too obvious? Small samples are not representative of the population they are sampled from. In inferential statistics, the term “null hypothesis” usually refers to a general statement or default position that there is “no result” in our data, no relationship between two measured phenomena, no association among groups, etc.. The alternative hypothesis usually refers to the result you would like to prove, or detect with your data. It’s the “positive” case, and it’s true if and only if the null hypothesis is false.
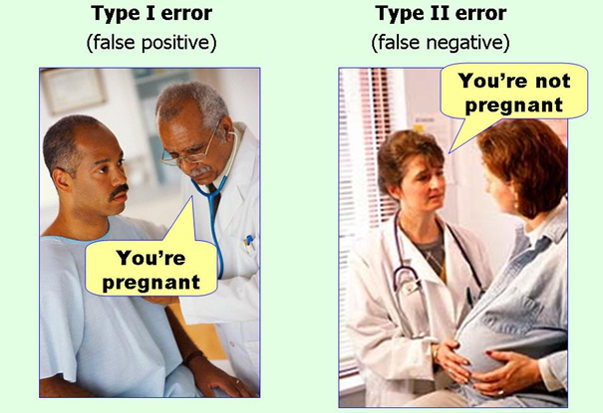
A type-I error is when your analysis says the null hypothesis is false, but it’s indeed true (a false positive). A type-II error (or false negative) is when your analysis says null hypothesis is true, but it’s indeed false. Examples of type-I and type-II errors are… look at the picture! Type-I errors, type-II errors, and sample size, are related in a complex way. It is possible to estimate in advance (to a certain extent) how large the sample size should be for your results to be reliable, i.e. keeping both type-I and type-II errors low. How many times have you seen the sample size estimation in the articles you read? I suspect very rarely.
Very often “insights” are given without having any idea of how much the conclusions extend to new cases. It means they don’t work. That’s why statistics is necessary, and not an option.
Difference in significance doesn’t mean significant difference
We compared treatments A and B with a placebo. Treatment A showed a significant benefit over placebo, while treatment B had no statistically significant benefit. Therefore, treatment A is better than treatment B.
This is an easy way of comparing medications, surgical interventions, therapies, and experimental results in any area. It’s straightforward. It seems to make sense. But it’s wrong.
A difference in significance doesn’t make a significant difference. One reason is the arbitrary nature of the p<0.05 cut-off. We could get two very similar results, with p=0.049 and p=0.051, and mistakenly say they’re clearly different from each other simply because they fall on opposite sides of the cut-off. The second reason is that p-values are not measures of effect size, so similar p-values do not mean similar effects. Two results with identical statistical significance can nonetheless contradict each other. The relation between p-values, practical significance, and the effect size has a long and controversial history. A good read about it is the statement recently released by the American Statistical Association on p-values and significance. Last but not least at all, results of data analysis must go through an interpretation process: no statistician, mathematician, or even worse software, can produce meaningful result alone.
This blog post focused on some common mistakes about statistical inference. But you will see how data analysis can be wrong, or deliberately lie, in many different ways. There are two kinds of statistics, the kind you look up and the kind you make up (Archie Goodwin, in Rex Stout’s Nero Wolfe novel Death of a Doxy).


